InsightIQ
Redesigning a B2B SaaS analytics dashboard so 2,000+ marketing teams could finally make sense of their data.
01 / The Challenge
A dashboard nobody wanted to open
InsightIQ had all the data marketing teams needed, but it was buried across six separate views with no connective tissue between them. Users had to click through an average of eight screens just to compare two metrics side by side. The result was predictable: only 34% of users bothered to check the dashboard on a weekly basis.
The business impact was real. Customer success teams fielded dozens of tickets each week from users who couldn't find the numbers they needed. Churn among mid-market accounts had crept up to 18% quarterly, and exit surveys consistently pointed to a "confusing" and "overwhelming" product experience as the top reason for leaving.
By the numbers
- 6 separate data views with no unified overview
- 34% weekly active engagement
- 8+ clicks to compare basic metrics
- 18% quarterly churn among mid-market accounts
Core questions
- How might we surface the right data at the right time?
- Can we reduce cognitive load without hiding useful detail?
- What does a "home base" for marketing teams actually look like?
- How do we serve both quick-glance and deep-dive use cases?
02 / Research & Discovery
Listening to power users and studying the landscape
I kicked off the project by scheduling 12 in-depth interviews with InsightIQ power users across different company sizes and industries. These were the people who lived in the product daily, and their frustrations painted a clear picture: the dashboard felt like a filing cabinet where every drawer was labeled in a different language.
Alongside interviews, I ran a competitive audit of Amplitude, Mixpanel, and Datadog, focusing on how each product handled data density, customization, and first-time user experience. The standout insight was that the best dashboards gave users control over their own layout without requiring them to build everything from scratch.
- 12 stakeholder interviews with marketing leads, data analysts, VPs, and growth PMs across 8 companies
- Competitive audit of Amplitude, Mixpanel, and Datadog focusing on dashboard patterns, widget systems, and onboarding flows
- Identified 4 key personas: Marketing Lead (needs quick KPIs), Data Analyst (needs deep drill-downs), VP Marketing (needs shareable executive views), and Growth PM (needs experiment tracking)
- Synthesized interview notes into an affinity map that revealed 5 recurring themes: data fragmentation, alert fatigue, lack of customization, poor mobile experience, and unclear data hierarchy
Key research insight
"Every person I interviewed had built their own workaround. Spreadsheets, Notion databases, screenshots pasted into Slack. The data existed in InsightIQ, but getting to it felt like more work than recreating it elsewhere."
03 / Information Architecture
Making 47 data points feel like 5
The old dashboard tried to show everything at once, which meant nothing stood out. I needed to restructure the information architecture so the most important metrics surfaced immediately while deeper data remained accessible without cluttering the view.
I ran a card sorting exercise with 8 participants, asking them to organize all 47 data points the platform tracked into groups that made sense to them. The results were remarkably consistent: users naturally clustered data into five logical categories: Performance Overview, Channel Breakdown, Campaign Health, Audience Insights, and Custom Reports.
This structure became the backbone of the new widget system. Instead of fixed pages, users would see a default dashboard built from these five clusters, with the ability to add, remove, reorder, and resize individual widgets. The idea was to give everyone a great starting point while letting power users make it their own.
- Card sorting with 8 participants across all 4 personas
- 47 data points reorganized into 5 logical clusters
- Designed a customizable widget system with smart defaults
- Created progressive disclosure patterns so summary cards expanded into detailed views on click
- Built a "Quick Compare" feature letting users drag any two metrics side by side
04 / Design Exploration
Three concepts, one clear winner
With the information architecture locked, I explored three distinct dashboard concepts in wireframe form. The first was a fixed layout with a rigid grid of cards, similar to Google Analytics. The second was a fully modular widget system where users could drag and drop anything anywhere. The third was a guided insights approach that used AI to surface relevant metrics based on the user's recent activity.
I tested all three concepts with 6 users in moderated sessions using clickable Figma prototypes. The modular widget approach won decisively, but with an important caveat: users wanted smart defaults, not a blank canvas. Nobody wanted to spend 20 minutes setting up their dashboard before they could use it. The final direction combined the flexibility of the widget system with curated templates based on the user's role.
Concept A: Fixed Layout
- Rigid grid, simple to understand
- Users felt it was "too basic" and "not much better than what we have"
- No personalization options
Concept B: Modular Widgets
- Drag-and-drop flexibility
- Users loved the control but wanted a starting point
- Clear winner when paired with role-based templates
Concept C: Guided Insights
- AI-driven metric surfacing based on user behavior
- Users were intrigued but didn't trust it: "What if it misses something important?"
- Incorporated as a secondary feature (insight nudges) rather than the primary interface
05 / Visual Design & Iteration
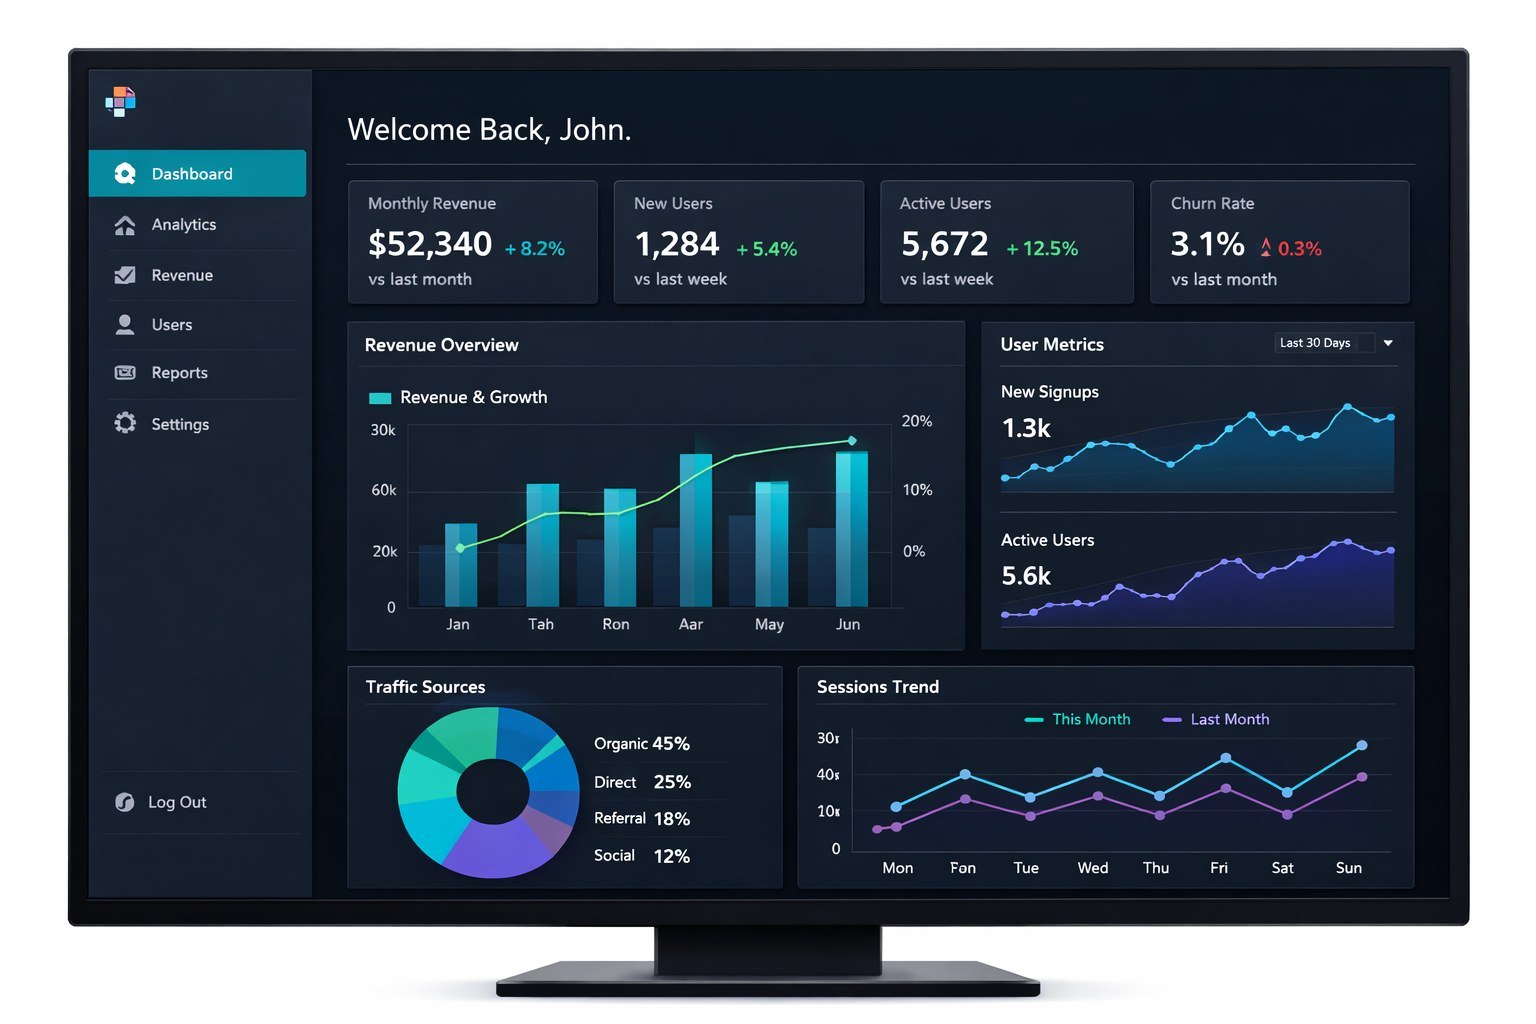
Dark theme, dense data, clear hierarchy
The visual design needed to handle serious data density without overwhelming users. I chose a dark theme as the default because it reduces eye strain during long analysis sessions and makes colored data points pop against the background. Teal served as the accent for positive metrics and growth indicators, while a warm red flagged alerts and declining trends.
I built 32 chart components in Figma, each designed to work at three different widget sizes (small, medium, and large). Every chart had consistent interaction patterns: hover for detail, click to expand, and right-click for export options. Typography followed a strict hierarchy with numbers rendered in a tabular font so columns always aligned cleanly.
The iteration process was relentless. I ran two additional rounds of usability testing on the high-fidelity prototype, catching issues like insufficient contrast on secondary labels and confusing iconography on the widget picker. Each round tightened the design until every element earned its place on screen.
Design decisions
- Dark theme default for data-heavy contexts
- Teal accent for positive trends, warm red for alerts
- Tabular numerals for aligned data columns
- Consistent chart interactions across all 32 components
Component library
- 32 chart components at 3 responsive sizes
- Role-based dashboard templates (4 presets)
- Widget picker with search, categories, and previews
- Drag handles, resize grips, and snap-to-grid behavior
06 / Outcomes
From dreaded to daily
The redesigned dashboard launched to all InsightIQ customers over a phased two-week rollout. The impact showed up in the data almost immediately. Weekly engagement more than doubled, jumping from 34% to 71% within the first month. Users were spending 2.3x longer in the product per session, and the average time-to-insight dropped by 40%.
NPS climbed from 23 to 52, and the customer success team reported a significant drop in dashboard-related support tickets. Most telling was the qualitative feedback: users who had previously built workarounds in spreadsheets started sharing InsightIQ dashboards directly in their team Slack channels.
Metrics that moved
- Weekly engagement: 34% to 71%
- Time-to-insight: reduced by 40%
- Session duration: increased 2.3x
- NPS: 23 to 52
Qualitative wins
- Support tickets for dashboard issues dropped 55%
- Users began sharing dashboards directly in Slack
- 3 enterprise clients cited the redesign in renewal decisions
- Widget customization adopted by 89% of active users
Client feedback
"The new dashboard turned our data from something we dreaded checking into something we actually look forward to." - VP of Marketing, Series B client